
From Management Zones to Continuous Soil Property Maps
How a handful of lab reports become a full soil property map for the entire field.
From point data to spatial understanding
In the first article, we covered how spectral management zones replace rigid grids for sampling. Once you've collected and analyzed a soil sample from each zone, the question becomes: how do you turn a handful of lab reports into a picture of the whole field? A lab result gives you precise numbers — phosphorus, potassium, pH — for one spot. But a single number doesn't tell you what's happening fifty meters away. The real challenge isn't measuring soil properties. It's figuring out how they vary across the field.
Beyond interpolation
The standard approach is to interpolate between sample points — essentially drawing smooth gradients from one value to the next. That works if soil properties actually change gradually and evenly, but they rarely do. They follow environmental structure, the same structure our management zones are built on. So we take a different path.
How we extend lab results
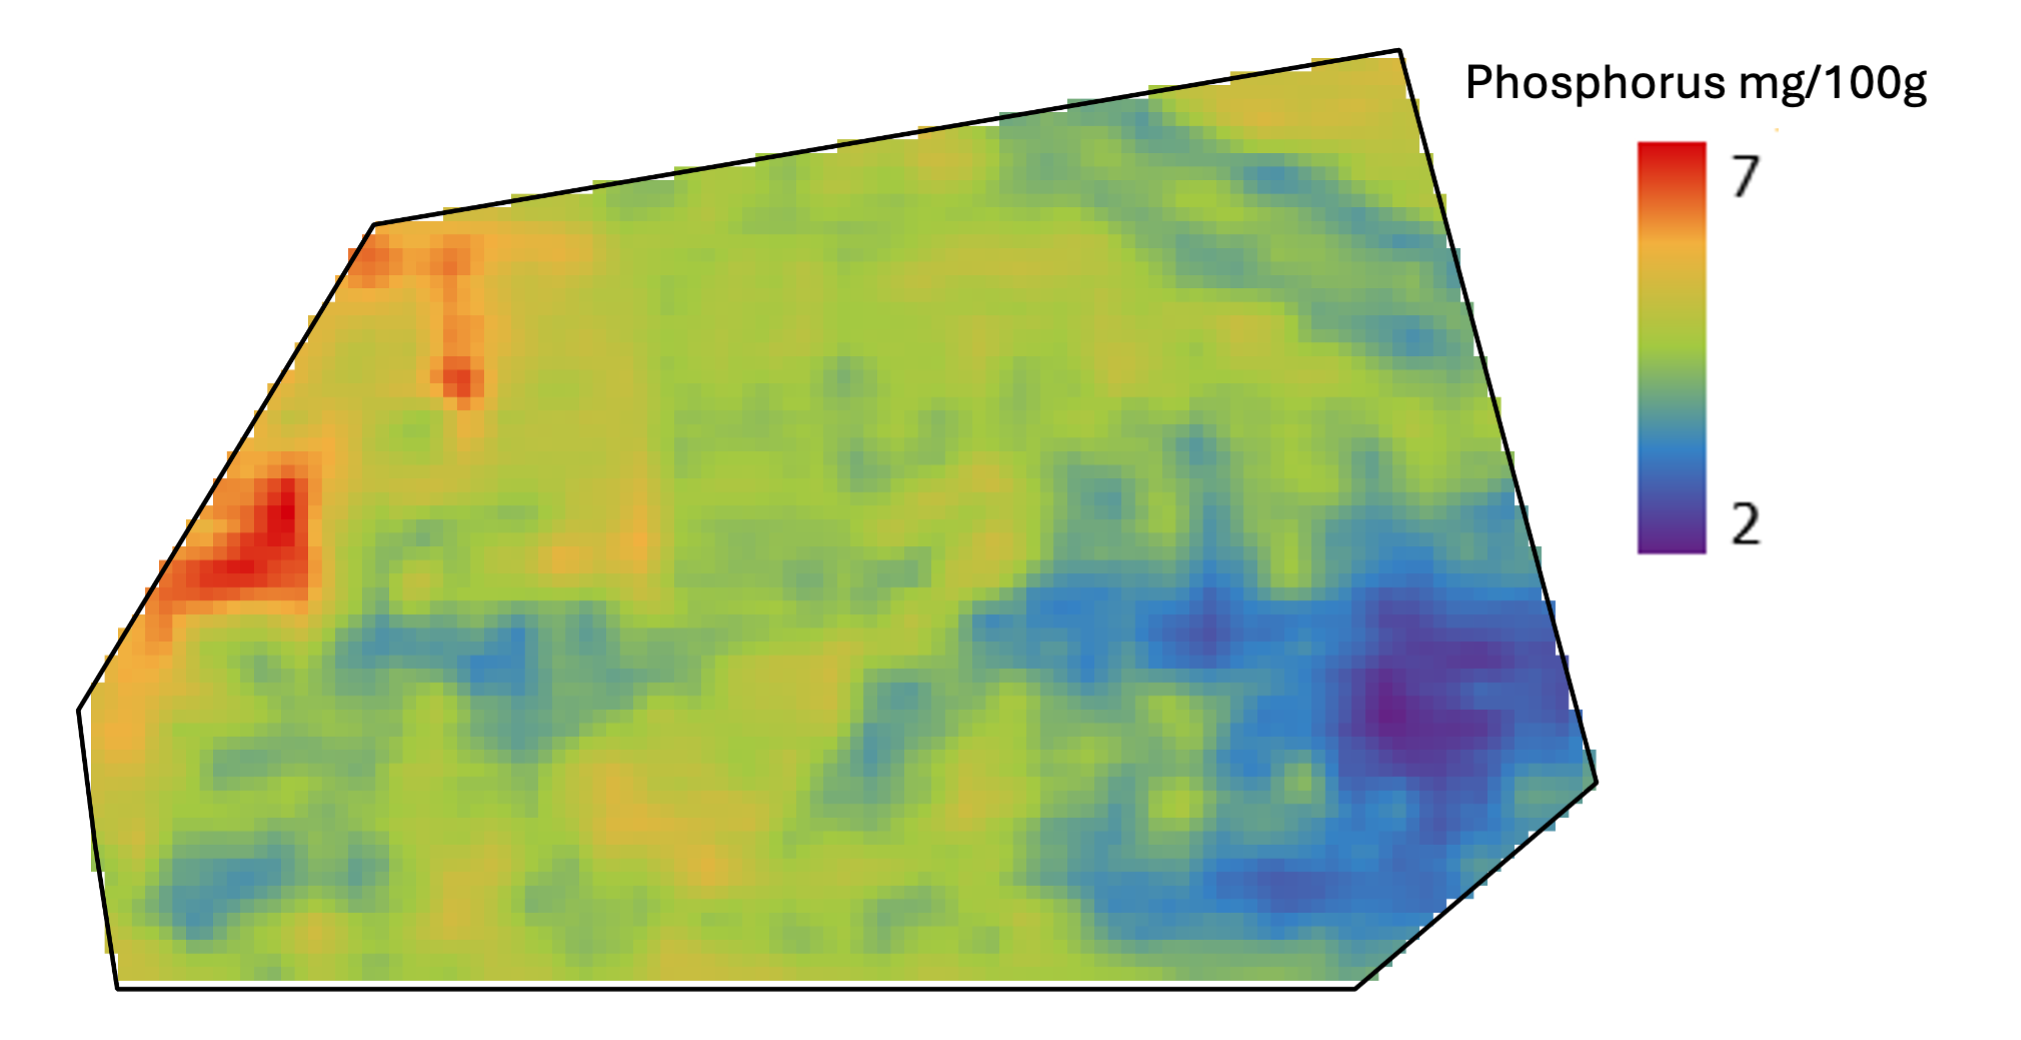
We use the environmental signature that defined each management zone to extend lab values across the field. Each sample gets linked to the spectral characteristics of its zone. Then, instead of just asking "how far is this pixel from the nearest sample point?", the system asks "how similar is this pixel's environment to a sampled zone?" The phosphorus map shown here isn't a smoothed interpolation. It's built from the same environmental patterns that shaped the sampling zones, combined with actual lab measurements. Areas with similar spectral behavior get similar phosphorus predictions. Areas with different structure are treated differently.
Key advantages
Transitions between zones follow natural patterns, not arbitrary geometric lines. Every predicted value is tied to environmental similarity, not just proximity. And the resulting soil map stays consistent with the management zones that started the whole process — there's no disconnect between how you sampled and how you mapped.
Bottom line
Sampling gave us structure. Now that structure supports prediction. Instead of drawing lines between dots on a map, we're extending measured knowledge across areas that actually behave the same way. The result is a soil property map that stays grounded in how the field really works — and that's the foundation for everything that comes next.

Wypróbuj teraz
Zobacz, jak Xsupra działa na Państwa polach — bezpłatny start.
Bezpłatny start — bez karty kredytowej