From Soil Property Maps to Clear Fertilization Zones
The step that matters most to the person on the tractor.
Turning maps into action
In the second article, we showed how lab results get extended across the field to produce continuous soil maps. Now comes the step that matters most to the person on the tractor: turning those maps into a fertilization plan. A soil map tells you where variability exists. An application map tells you what to do about it. Once a property like phosphorus is mapped across the entire field, the next step is grouping those values into management classes. Areas with similar phosphorus levels get bundled into fertilization zones, each with its own application rate. That's what turns a wall of continuous data into something you can actually load into a spreader.
How classification works
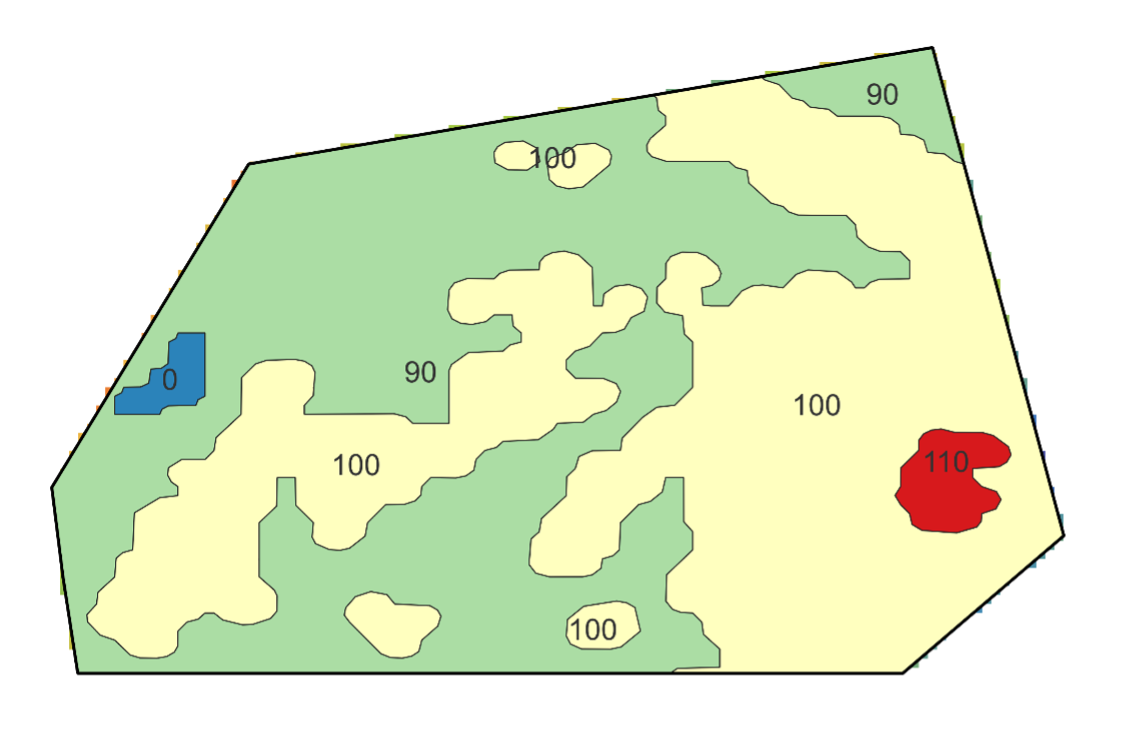
The image shows how this plays out. Each part of the field gets assigned to a phosphorus class. Zones with lower levels are grouped together and get a higher application rate to build up supply. Areas that are already well-supplied receive a maintenance dose. Zones with elevated phosphorus may need little or nothing at all. The field ends up divided into practical operational zones — not a different rate for every square meter, but stable, consistent zones that make sense for real spreading equipment. That's important, because the best agronomic recommendation in the world is useless if your machine can't follow it.
Why classified zones work better
Fertilizing this way has clear advantages over a flat rate or reacting to how the crop looks above ground. It follows what the soil actually needs, not what the canopy suggests. It avoids dumping inputs where they're not needed and starving the spots that are actually deficient. And it gives you a clear structure: every part of the field belongs to a defined class, every class has a defined rate. No guesswork.
Bottom line
Instead of spreading the same rate everywhere or adjusting on the fly based on crop appearance, you're matching inputs to measured soil supply. Each zone gets what it needs. That's the last step in turning soil data into a precise, executable field operation.

Try it now
See how Xsupra works on your fields — free to get started.
Free to get started — no credit card required