
Solutions
Soil sampling that actually reflects your field
Stop treating your field like a checkerboard. We find where it truly varies, so every sample counts — and the resulting soil maps show what's really going on.
Free to get started — no credit card required
Why grid sampling falls short
Grid sampling assumes soil changes at regular intervals. It doesn't. Soil varies with drainage, slope, management history, and geology — none of which follow a grid. You end up over-sampling uniform areas and missing the spots that matter. And when the results get interpolated, the maps smooth over the very variation you paid to measure.
Zone-based sampling, model-based maps
We use satellite time-series and terrain data to identify zones in your field that genuinely behave differently. You take one sample per zone. Then, instead of simple interpolation, our models predict soil properties continuously across the entire field — capturing transitions, gradients, and variation that interpolation destroys. The result: high-resolution soil property maps from fewer samples.
Grid + interpolation vs. modeled soil maps
Traditional soil sampling uses a fixed grid, then interpolates between points — smoothing over the very variation you paid to measure. Our approach models soil properties based on environmental similarity, using satellite and terrain patterns to predict what's actually in the ground.
Traditional: Fixed grid sampling
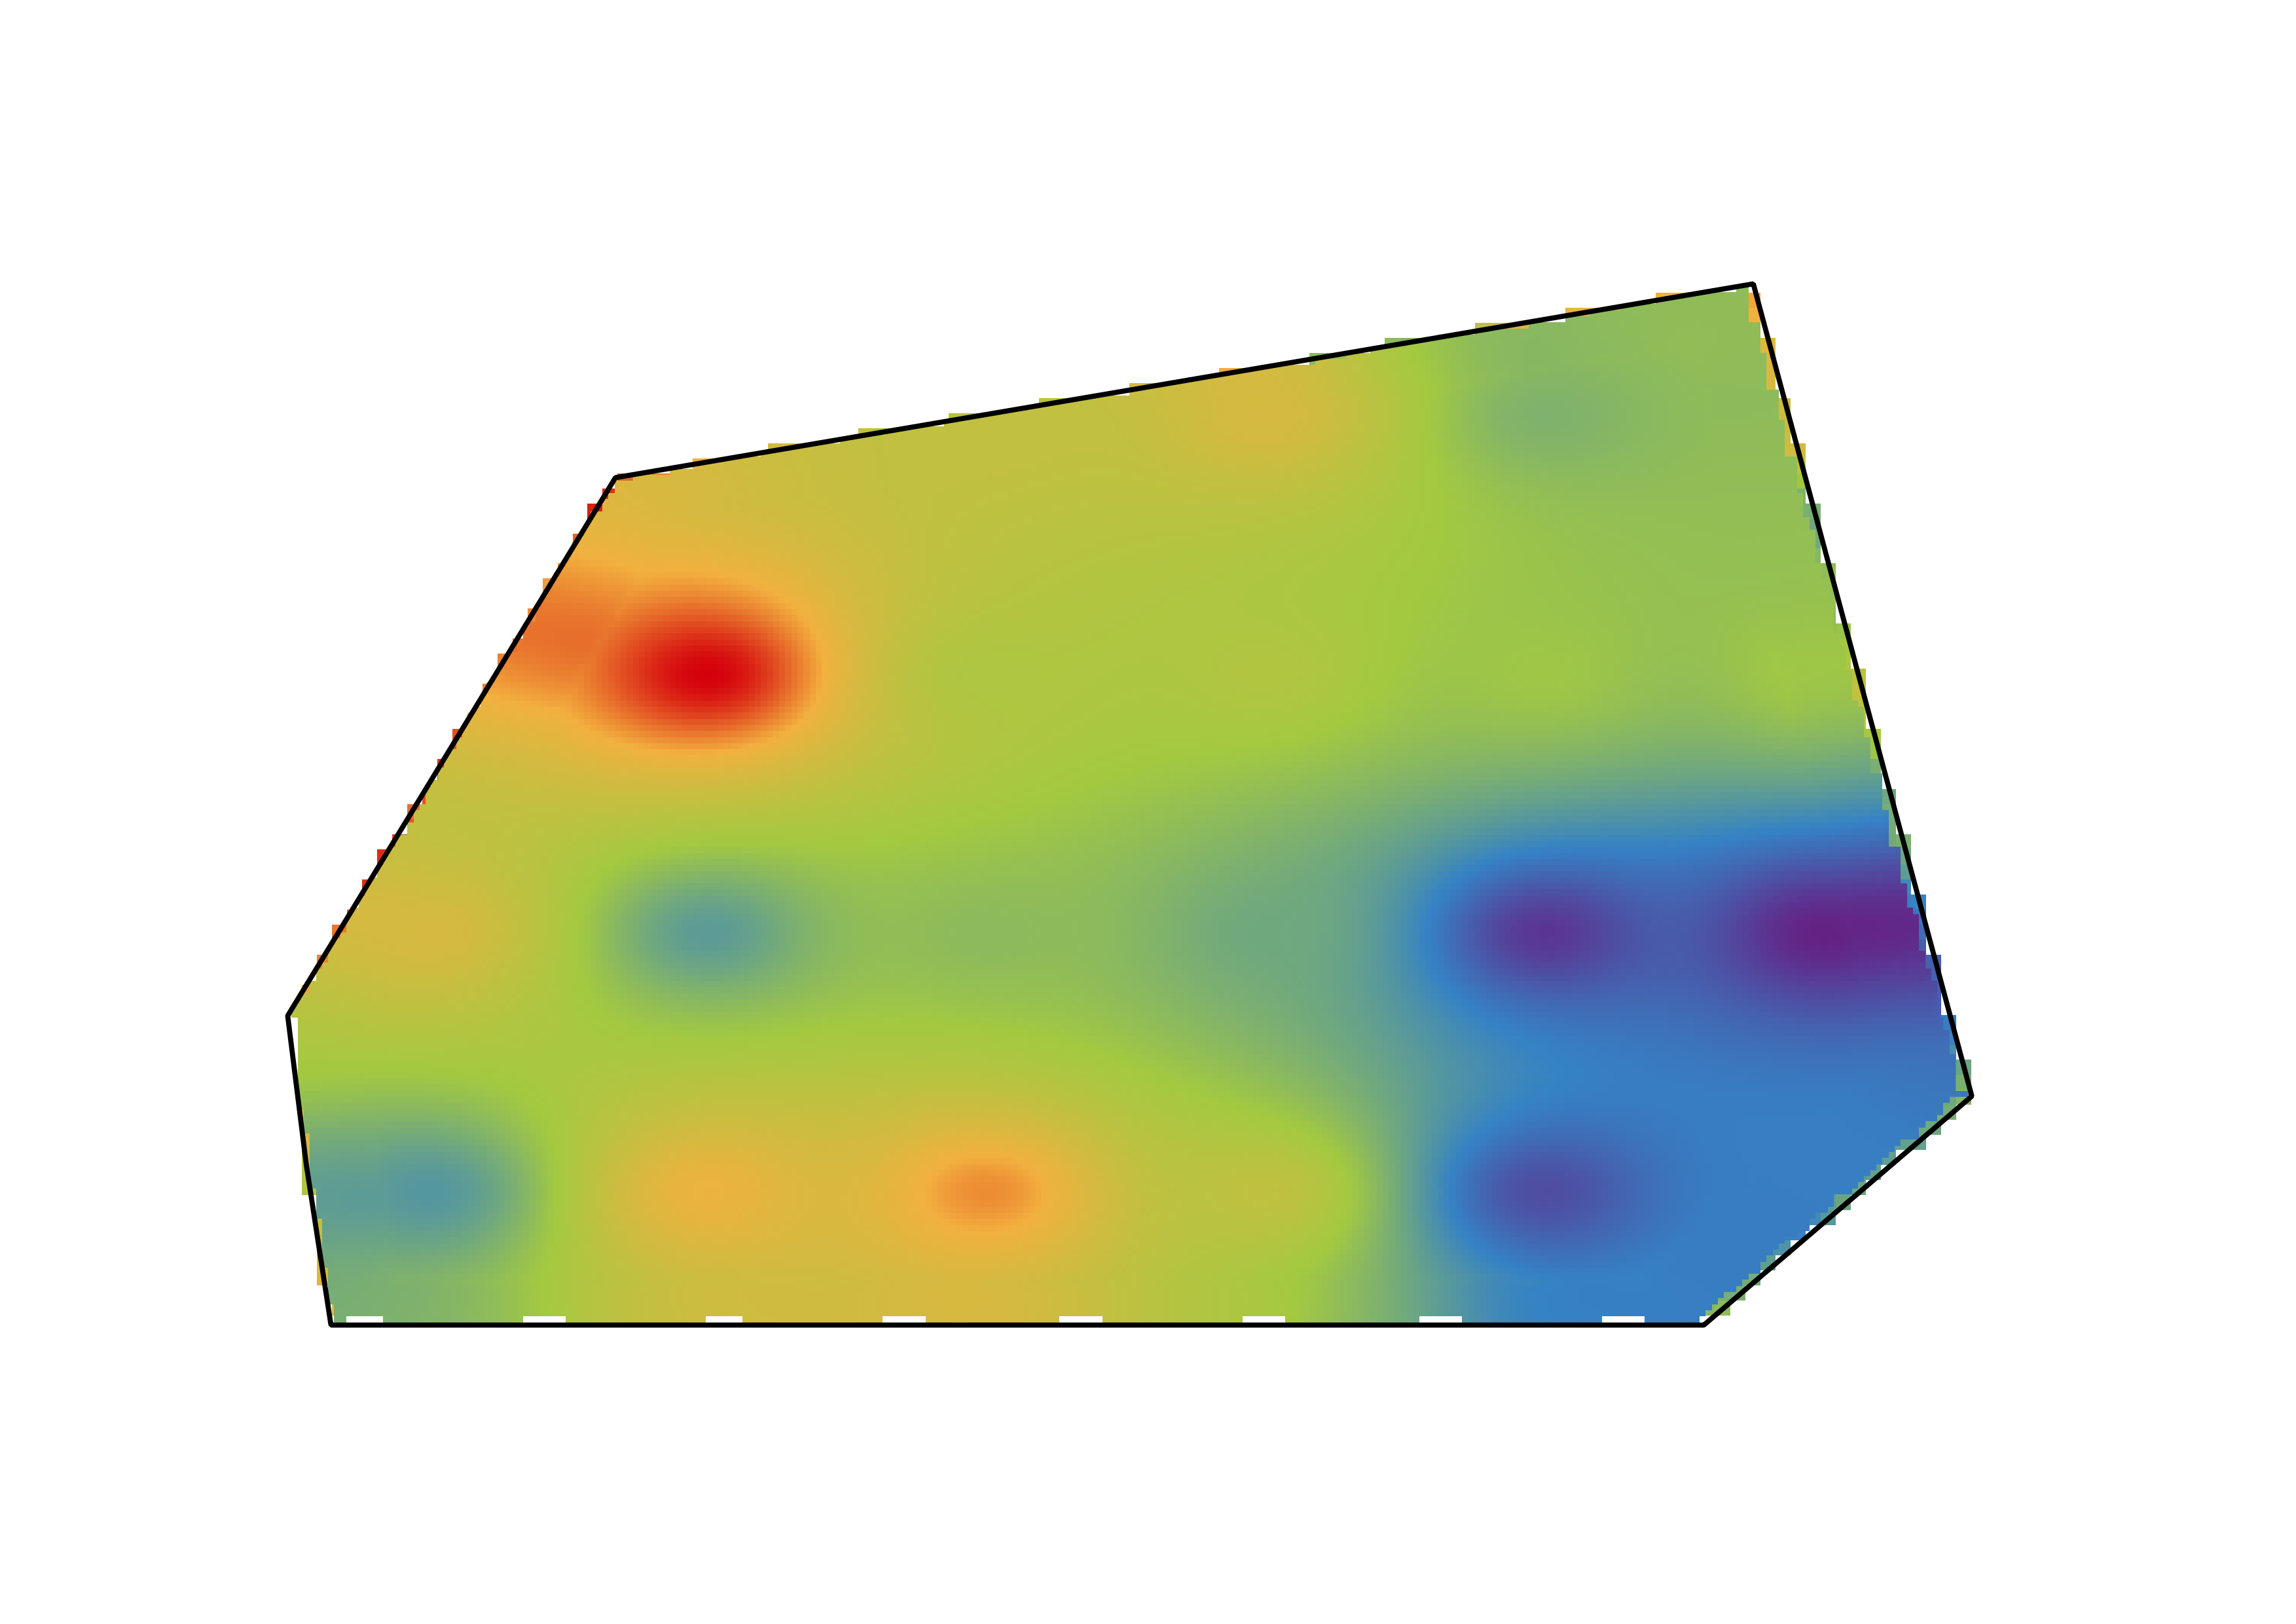
Interpolation creates rough patches with artificial boundaries
Interpolation smooths over real soil differences between points
Needs many expensive samples — and still just interpolates between them
Xsupra: Precision soil maps
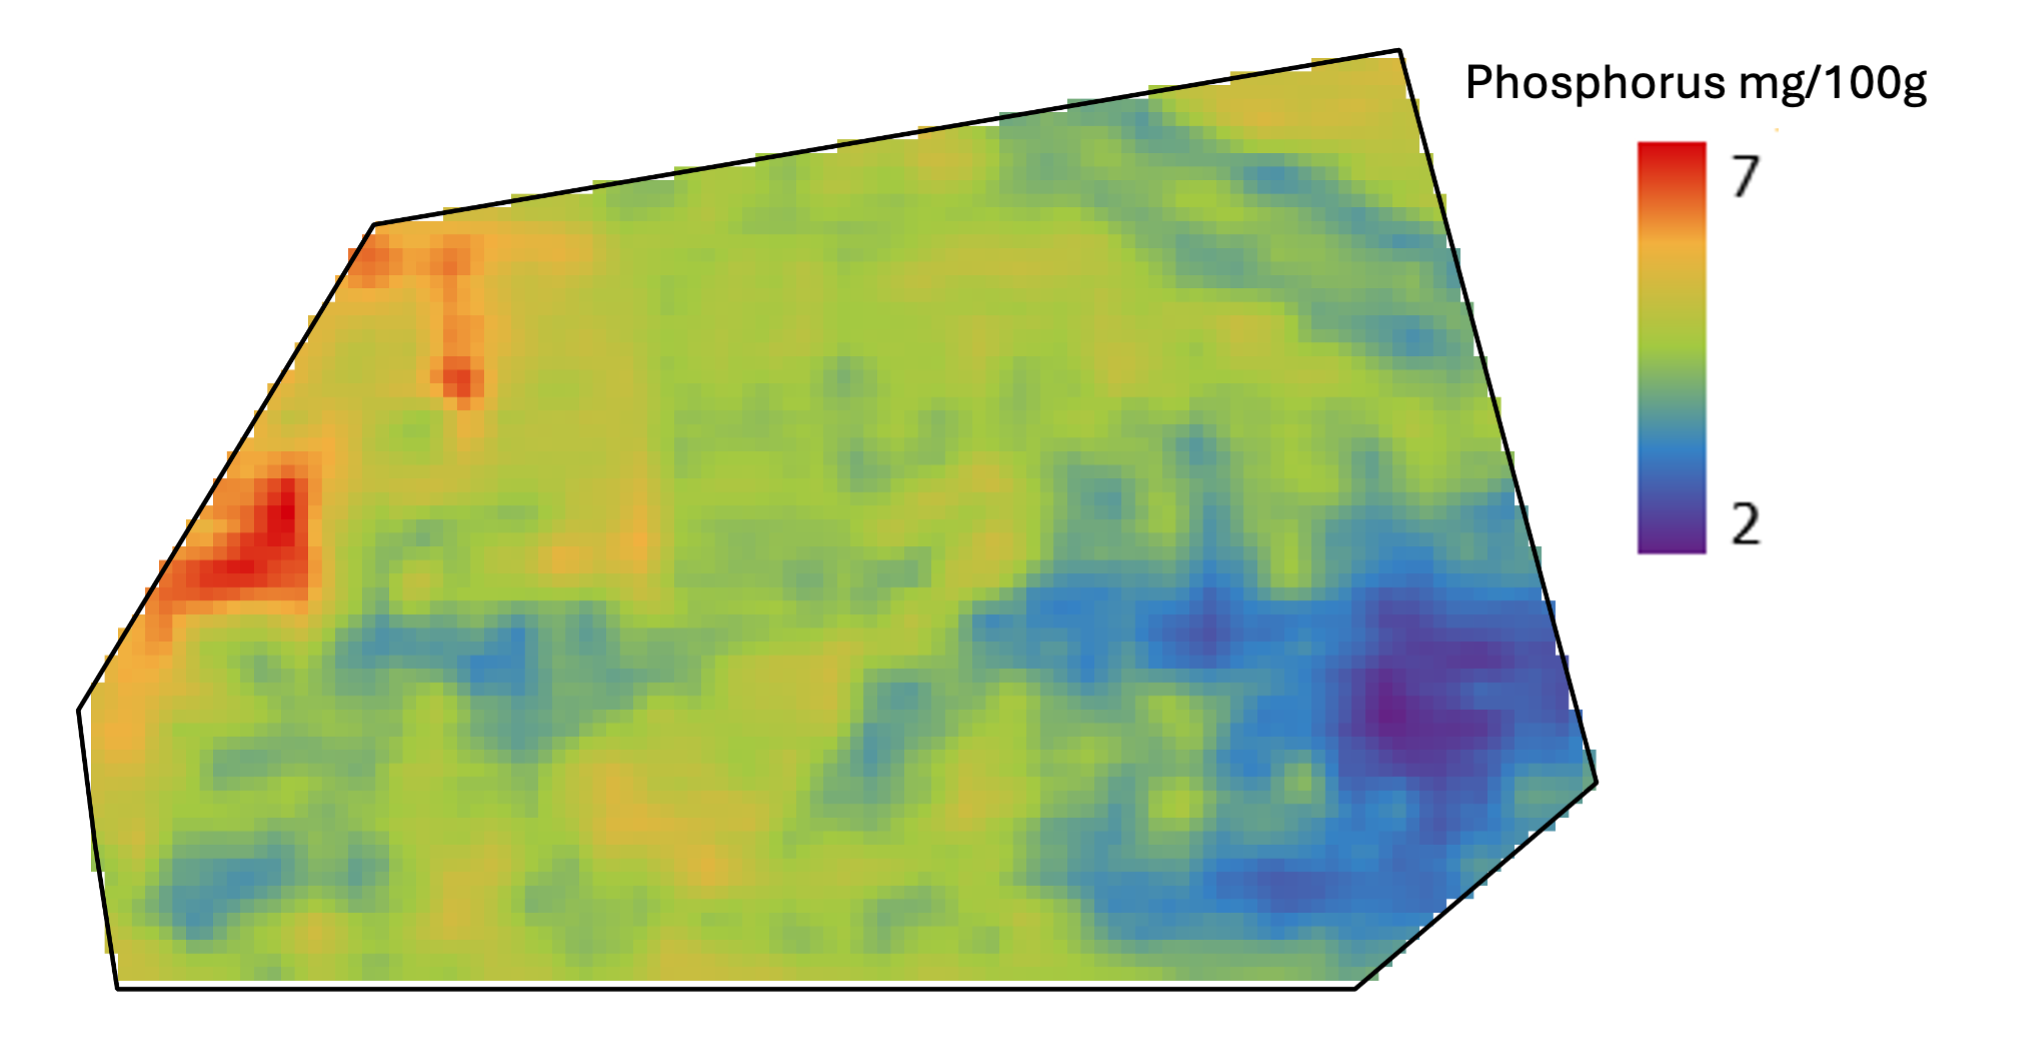
Modeled maps that follow real environmental structure
Modeling captures real variation based on environmental structure
Modeled from spectral and terrain patterns — fewer samples, more accurate maps
Explore soil data on any device
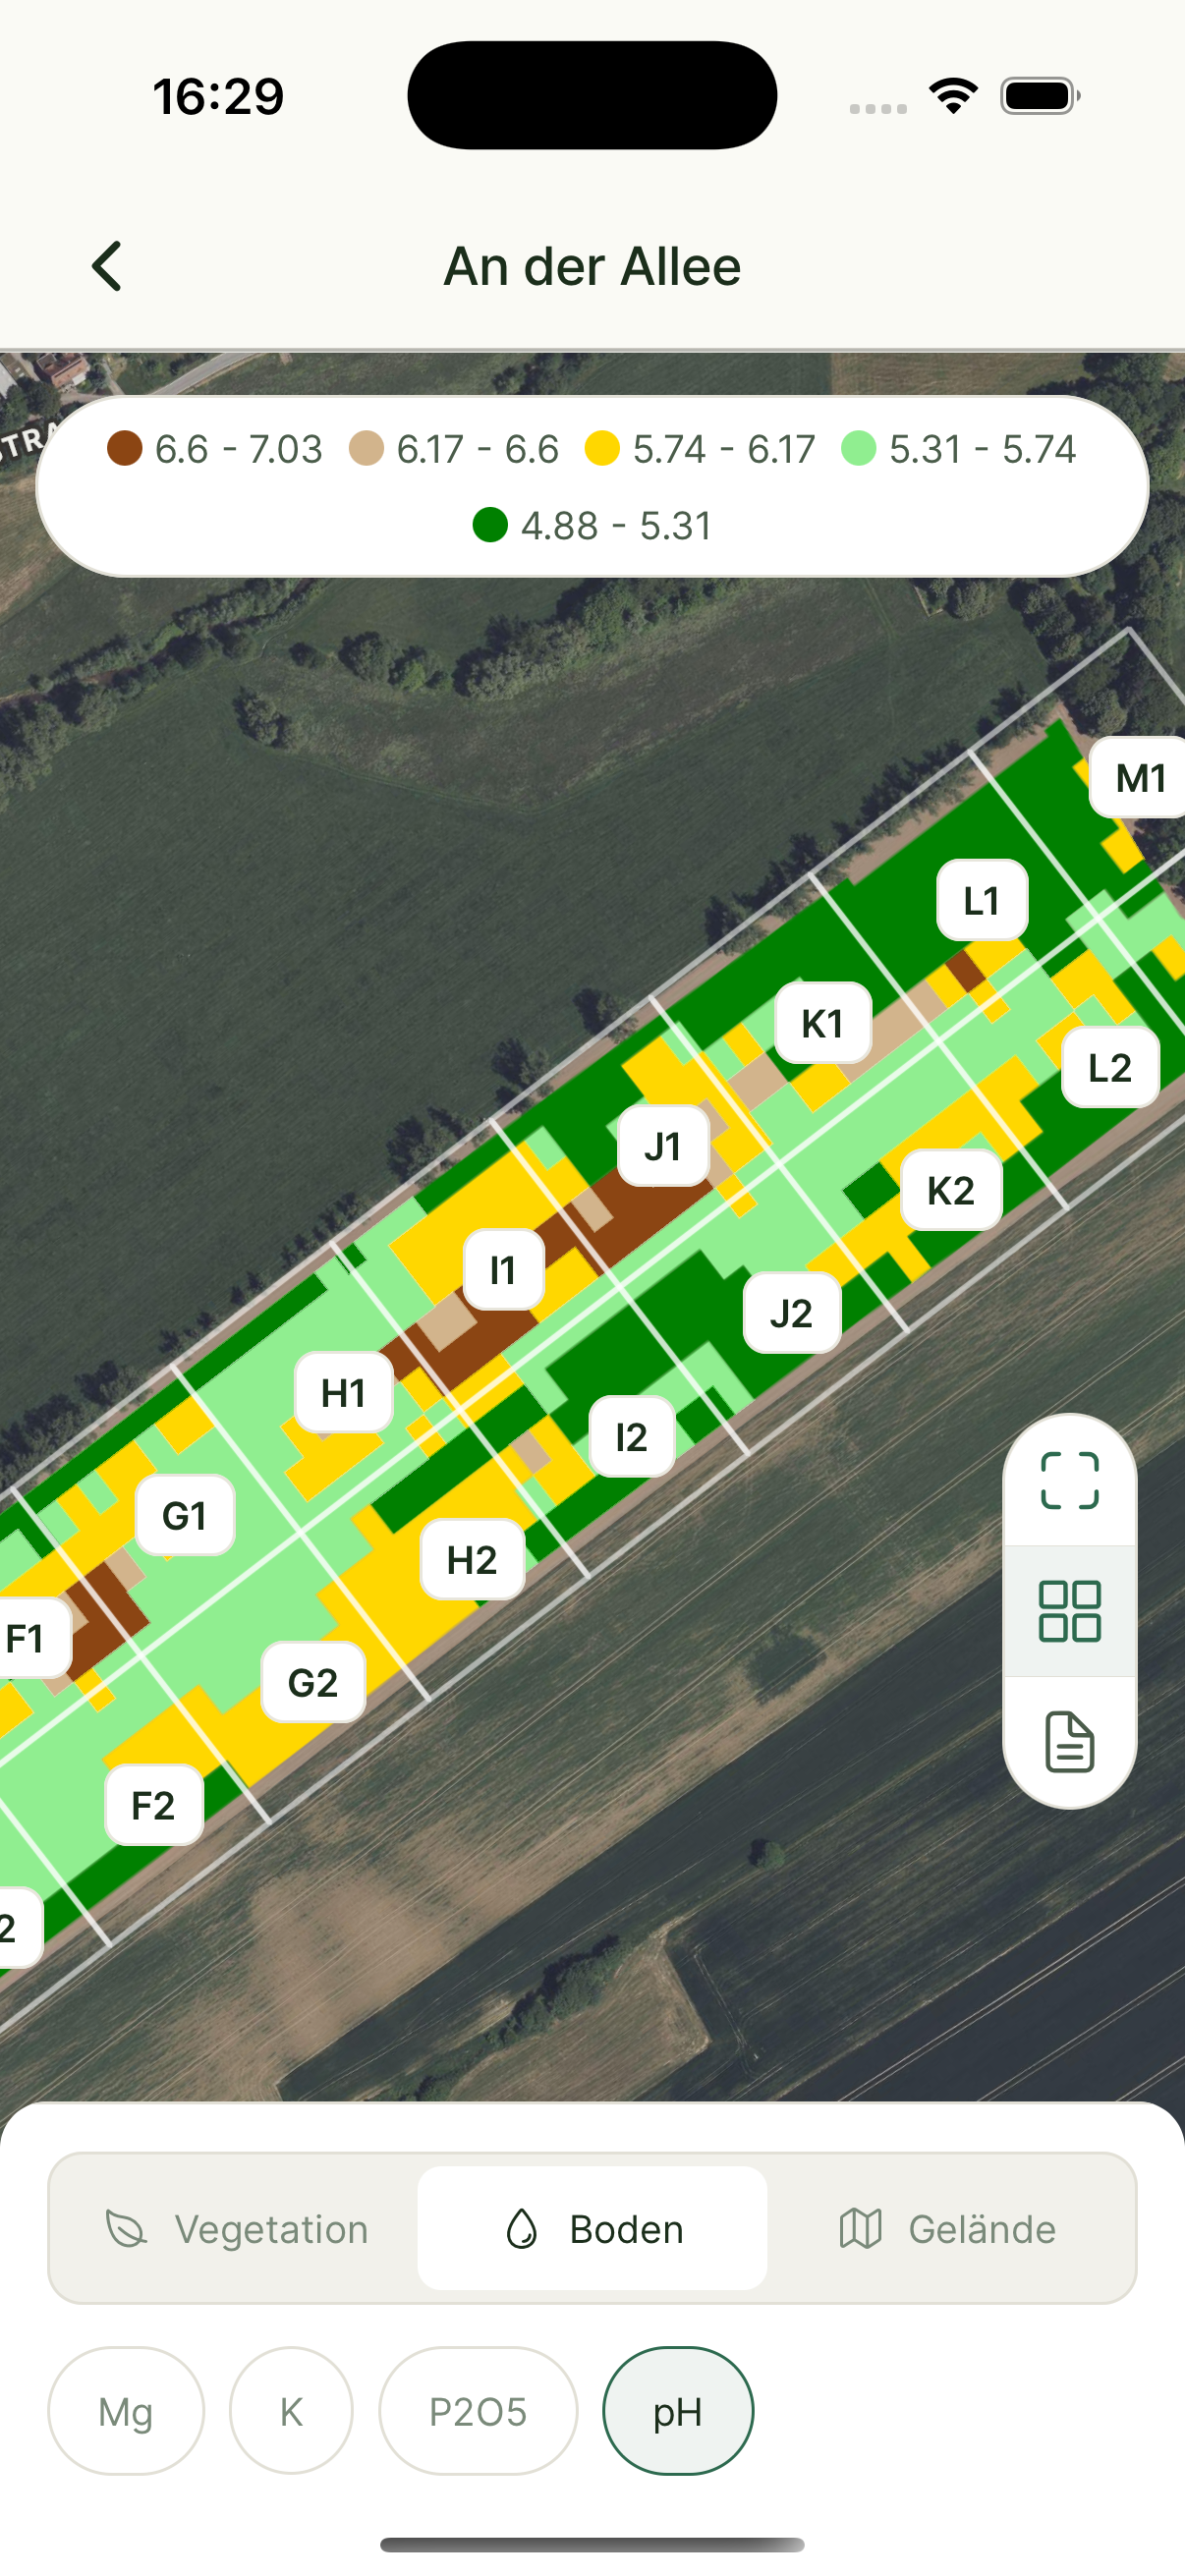
Soil pH Map
See pH values for each zone on the map
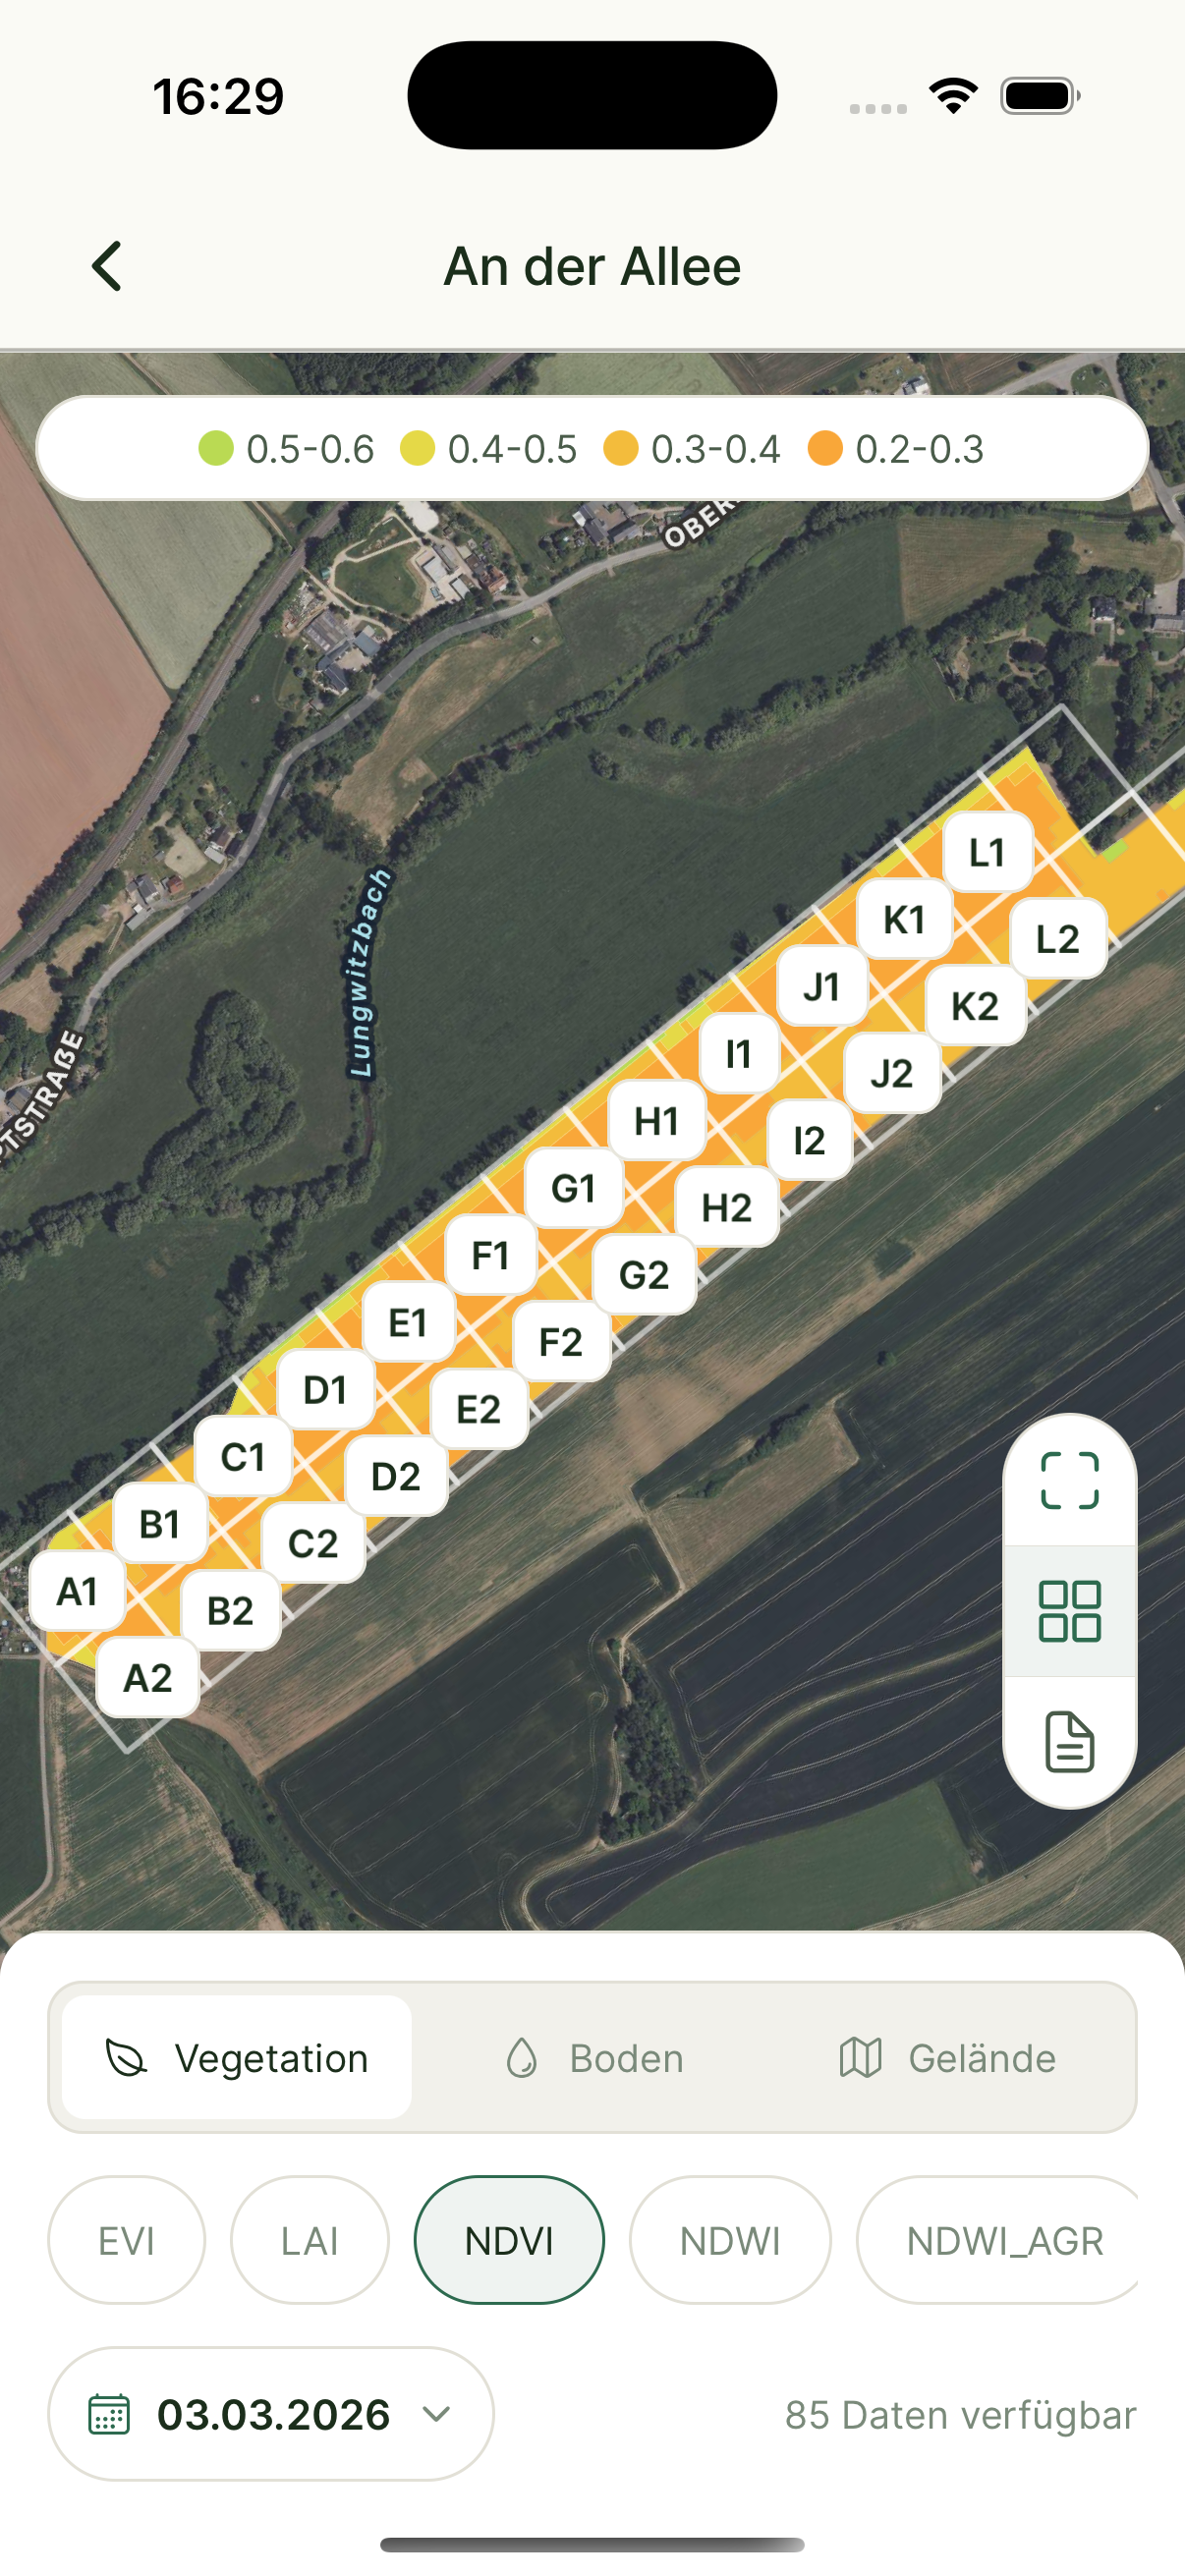
Crop Health Map
See crop health per zone from satellite
How it works
We identify distinct zones in your field using satellite and terrain data
You take one sample per zone and send it to the lab
Our models build continuous soil property maps across the whole field — not just interpolated points
Why this matters
Fewer samples, better maps — because every sample is taken where it counts
Real soil variation captured, not grid-line artifacts
Accurate foundation for nutrient management and application maps
Lower sampling costs without sacrificing map quality
What Farmers Say
“We compared Xsupra's sampling results with our in-house approach: the 10 x 10 m grid is significantly more accurate and precise. With the soil maps, we save up to 50% on fertilizer and about 6 hours per week on field inspections. The service and onboarding were very dedicated and professional — it's a pleasure to work with.”
Mathias Dippe
Agrar Dippe GmbH & Co. KG — 880 ha, 14 crops, Saxony-Anhalt

Ready to see how it works on your fields?
Book a free call. We'll look at your situation together — no sales pitch, just an honest conversation about whether Xsupra fits.
Free to get started — no credit card required