How much does rainfall drive satellite NDVI in Sachsen Anhalt?
A comprehensive analysis of the relationship between rainfall and vegetation health using satellite data from 2018 to 2024
At Xsupra we quantify crop condition using NDVI, vegetation index, computed from satellite images that compare near infrared reflectance to red reflectance. The index ranges from 0 to 1, higher numbers indicate more active vegetation. To make a fair comparison across years, we focus on croplands within Sachsen Anhalt and examine the same month across multiple years, July from 2018 to 2024.
For each July, we produce a cloud screened satellite composite, calculate NDVI, mask to croplands, then compute the area weighted mean NDVI for the state. In parallel, we aggregate total rainfall for the same region and month. This pairs a physical vegetation signal with the water input that commonly limits growth in midsummer.
Key findings, method consistent across years
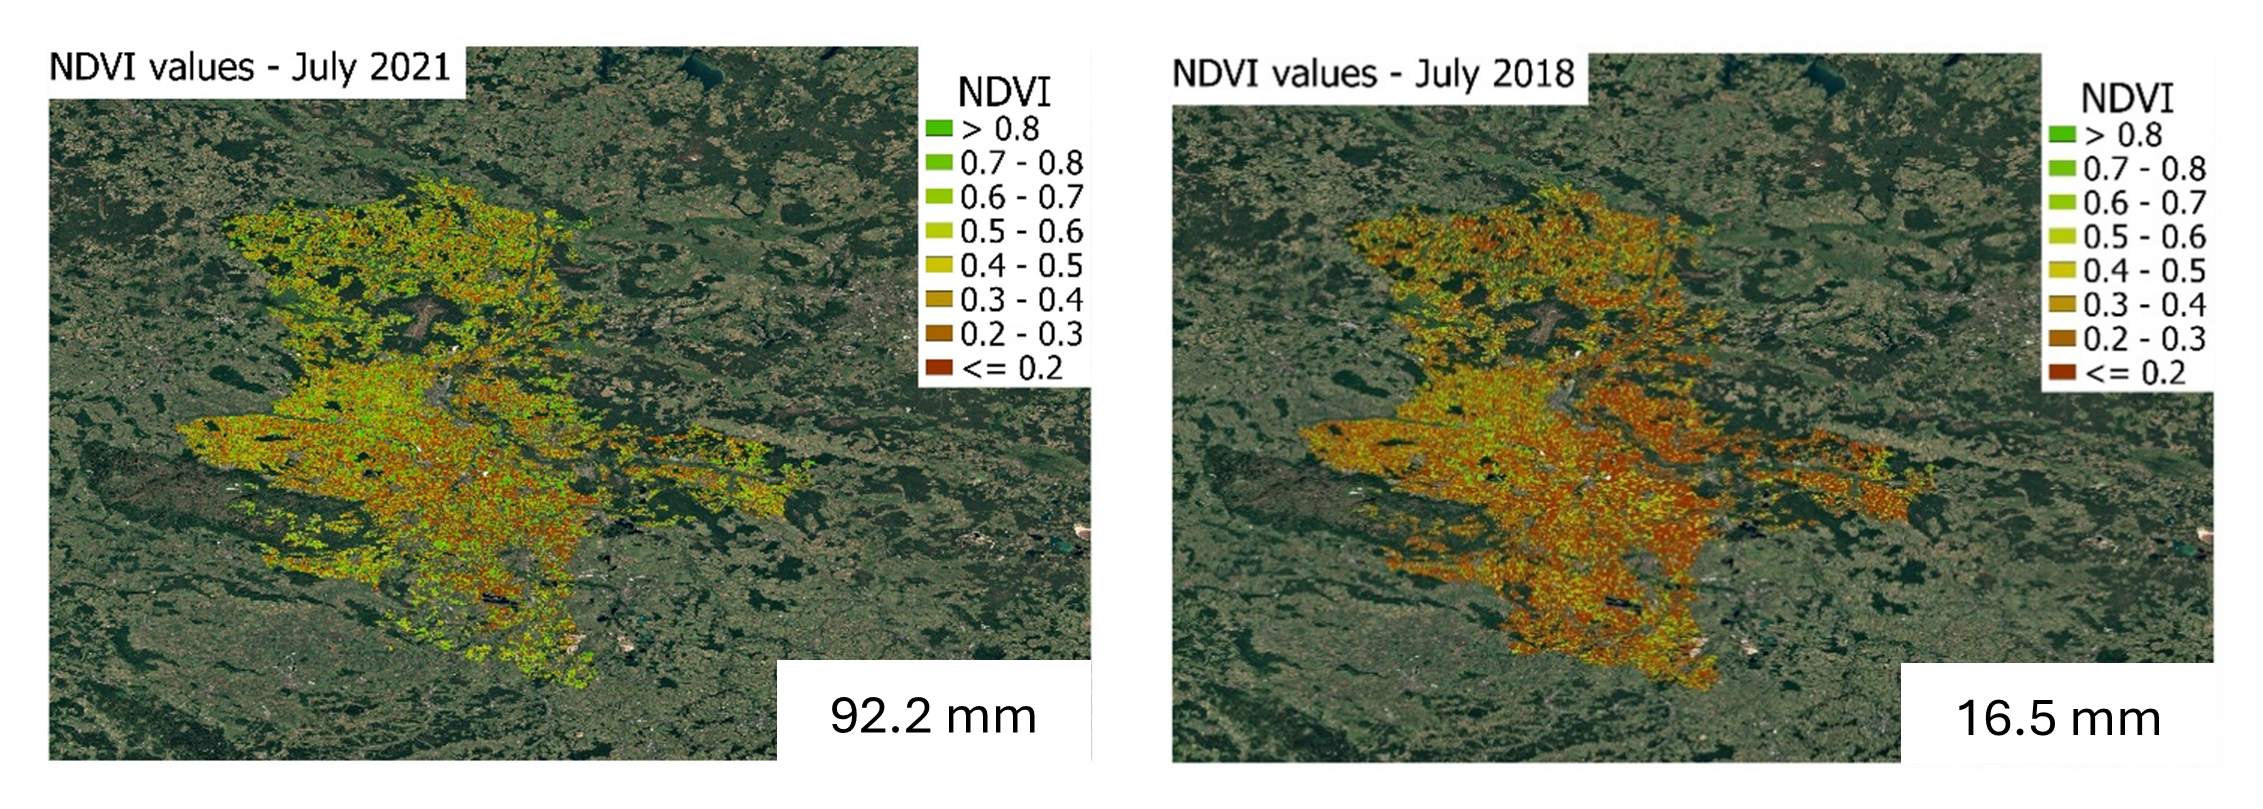
- Driest July: 2018, rainfall 16.5 mm, mean NDVI 0.31
- Wettest July: 2021, rainfall 92.2 mm, mean NDVI 0.42
- From driest to wettest, rainfall increased by about 457 percent, NDVI increased by about 42 percent
Korrelation zwischen Juli-Niederschlag und NDVI in Sachsen-Anhalt (2018-2021)
Relationship over the full multi year series
We assessed how July rainfall and July NDVI move together across all seven years. The association is strong and positive, correlation about 94 percent. In variance terms, rainfall accounts for about 88 percent of the year to year differences in July NDVI for croplands at the state scale. In practical terms, more rain generally produces higher NDVI in July, less rain leads to faster drying, higher water stress, and lower NDVI. The signal remains robust despite normal sources of variation, crop mix, sowing dates, temperature swings, and management choices.
Why NDVI is suitable for this task
NDVI responds to chlorophyll absorption in the red and cell structure reflectance in the near infrared, therefore it is tightly coupled to leaf area and photosynthetic activity. Monthly compositing suppresses day to day noise, cloud artifacts, and single pass outliers, giving administrators and farmers a stable vegetation activity metric. Masking to croplands improves specificity, since non agricultural pixels, urban or forest, can dilute the cropland response.
What Xsupra's pipeline enables, beyond this chart
- Field scale NDVI and other vegetation indices processing, same method every month, suitable for monitoring and comparison
- Rapid turnaround, automated ingestion of satellite images, quality screening, compositing, and statistics
- Delivery formats for real work, GeoTIFF rasters
- Extensions on request, historical benchmarking, soil moisture and field capacity context, trafficability readiness
What this means for farmers
- More July rain usually means higher NDVI, crops stay greener and more productive for that month
- Less rain means quicker drying, more stress, lower NDVI, expect slower growth and patchier fields
- You can use the NDVI values plus rain view to decide where to scout, when to irrigate if available, and how to prioritize inputs
- We can set this up for your fields, you get simple charts and files you can act on, plus consistent updates that make comparisons easy
Erhalten Sie Ihre Feldanalyse
Bereit zu sehen, wie Niederschlag Ihre Felder beeinflusst? Erhalten Sie detaillierte NDVI-Analyse und Niederschlagskorrelation für Ihre spezifischen Felder mit Xsupra.
Analyse starten
Try it now
Free to get started — no credit card required